
Visual Linux System Monitor & Telemetry
Stop staring at static terminal text. Monitor CPU cores, RAM, Swap, Load Averages, and network throughput in real-time with rolling 60-second sparklines — with zero daemon installation.
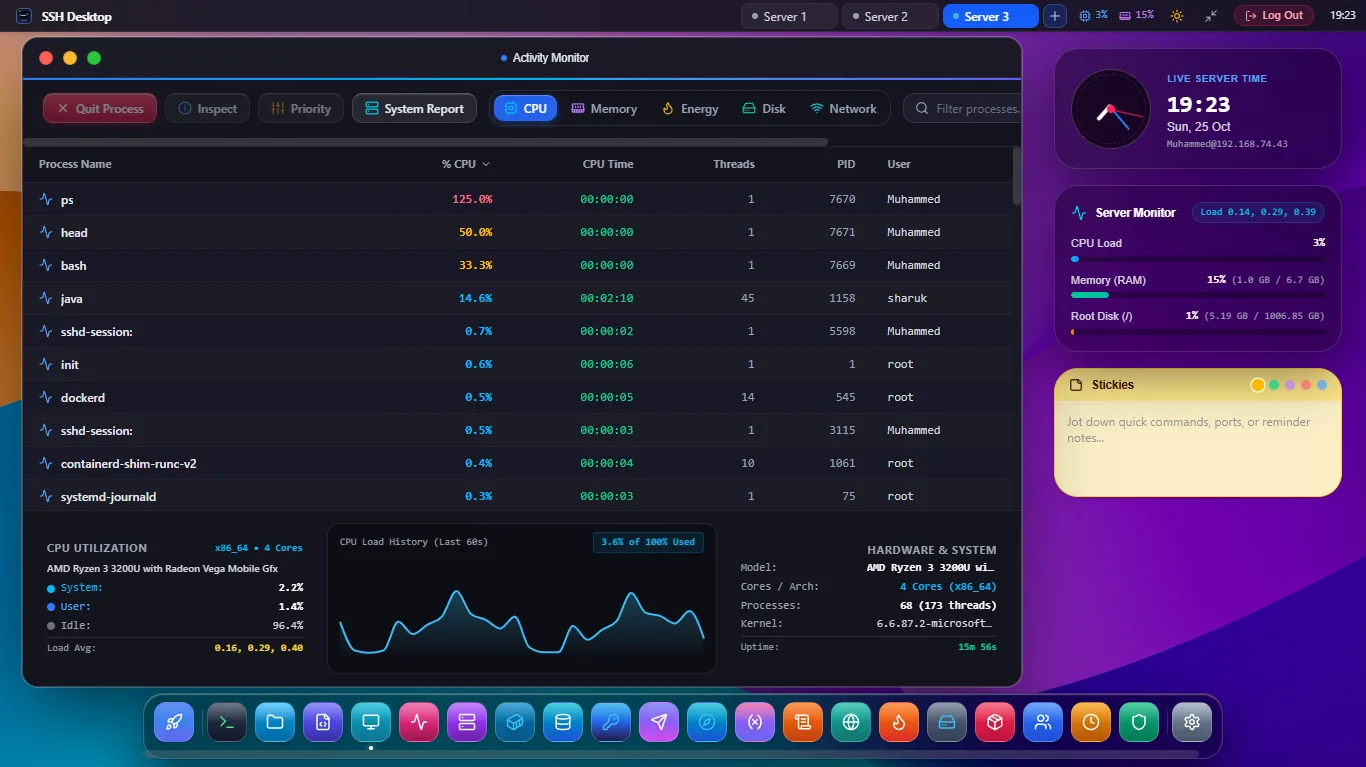
Zero-Agent Kernel Virtual Filesystem Inspection
Direct /proc Parsing
Parses /proc/stat, /proc/meminfo, and /proc/loadavg directly over SSH. Zero Python, Node.js, or Go background daemons required on your target server.
60-Second Sparklines
Interactive 60-second historical sparkline graphs visualize sudden CPU spikes, memory leaks, and disk I/O bottlenecks before they crash your services.
Network Bandwidth Meters
Live ingress and egress throughput speedometers in KB/s and MB/s parsed from /proc/net/dev across eth0, wg0, and docker0 interfaces.
Why Agentless Telemetry Beats Heavy Web Dashboards
| Telemetry Metric | SSH Desktop (App 9) | Webmin / Cockpit | Prometheus + Node Exporter |
|---|---|---|---|
| Server Footprint | 0 MB RAM (Agentless) | 60 - 200 MB RAM daemon | 80 - 150 MB RAM daemon |
| Public Ports Opened | 0 (Runs over SSH Port 22) | Port 10000 or 9090 open | Port 9100 open to scraping |
| Multi-Core Visualization | Live per-core color gauges | Aggregated text only | Requires Grafana dashboard |
| Update Latency | 1,000 ms real-time stream | 5,000 - 15,000 ms polling | 15,000 ms scrape interval |
Frequently Asked Questions
How does SSH Desktop calculate accurate CPU percentage?
It reads consecutive snapshots of /proc/stat and computes the delta between user, nice, system, idle, and iowait jiffies. This yields the exact same precision as the native Linux top command.
Does it track RAM buffers and cache separately from used memory?
Yes. The memory meter separates actual application memory from kernel buffer cache and reclaimable page cache, preventing false "out of memory" panic alarms common in basic monitoring tools.
Can I jump from a CPU spike directly to the culprit process?
Yes! Clicking any CPU or RAM spike immediately launches App 10: Process Manager, pre-sorted by resource consumption so you can inspect or kill the offending PID in seconds.
Experience Effortless Linux Server Telemetry
Download SSH Desktop for Windows, macOS, or Linux. Free and open source with 25 built-in server management tools.